I live and breathe football. Not American football, although I do love that as well, but European football aka footy aka soccer for the uninitiated. If you don’t believe me, ask my Footyball Sh*thousery group chat. They will assure you of my love for Chelsea Football Club and the beautiful game in general. We are always discussing football analytics, watching matches, sharing memes, and generally just talking trash.

While I was at Oracle CloudWorld, the massive cloud-focused, Oracle-hosted global conference September 18-21, 2023 in Las Vegas, Nev., I was able to attend several interesting sessions. Some were about cybersecurity and risk management, while others were about data science and analysis. There was even a session on football (soccer). As a die-hard Chelsea FC, LAFC, and Angel City FC supporter, I added the session to my schedule as soon as I saw it. I promise this article is not [entirely] about football.
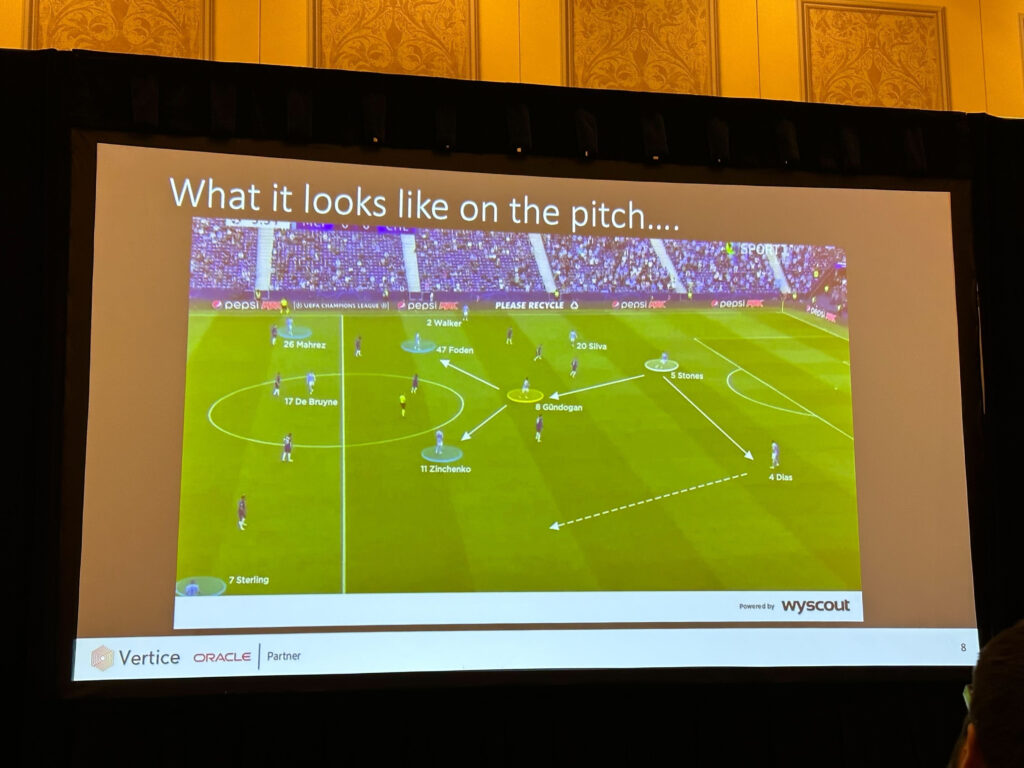
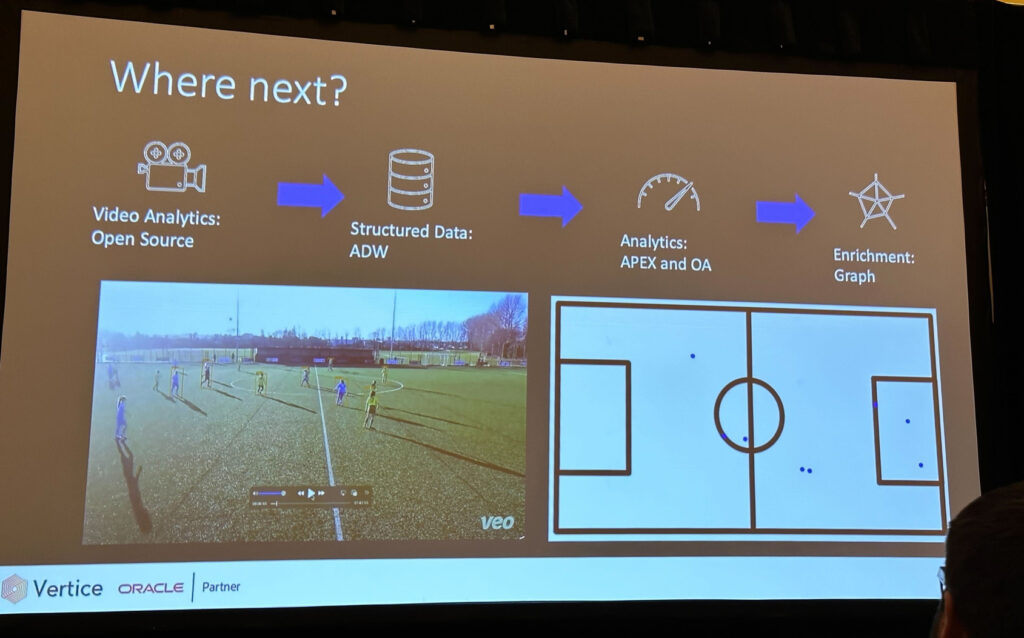
Hosted by two people from Vertice Integration Services Limited, a UK-based Oracle Partner, the session focused on leveraging Graph Studio in Oracle Autonomous Data Warehouse (ADW). ADW was used to explore data and visualizations related to football to help coaches learn and develop strategies.
Oracle is the official analytics partner of the English Premier League; however, this was a different type of application of Oracle’s capabilities.
Dr. Abi Giles-Haigh, Vertice’s Chief Data and Technology Officer, is also a UEFA-licensed semi-pro coach in Newcastle upon Tyne (Newcastle), England. As a fellow data nerd, she decided to test out an idea: leveraging the power of Oracle Cloud Infrastructure (OCI) to analyze how her team’s passing patterns impacted other statistical categories and overall results.
Origins of Football Analytics
The power of sports analysis was popularized in main stream media following the theatrical release of the 2011 film “Moneyball.” It is based on the Michael Lewis’ 2003 non-fiction book, Moneyball: The Art of Winning an Unfair Game. The movie stars Brad Pitt as Oakland Athletics general manager, Billy Beane, and Jonah Hill as his assistant general manager, Peter Brand, set against the backdrop of the 2002 Major League Baseball season.

Beane and Brand used statistical analysis with an emphasis on in-game metrics (SABRmetrics or sabermetrics) to scout and analyze players. In doing so, they were able to identify undervalued players and build a team of undervalued players. While the Athletics lost the American League Division Series (ALDS) for a second consecutive year, other teams begin to realize sabermetrics was the future of baseball.
However, in-game analysis of football matches began more than 50 years earlier.
The concept of recording statistics during football matches and analyzing them after originated with a man named Charles Reep shortly after World War II. Reep “quickly established himself as the first performance analyst in professional football.”
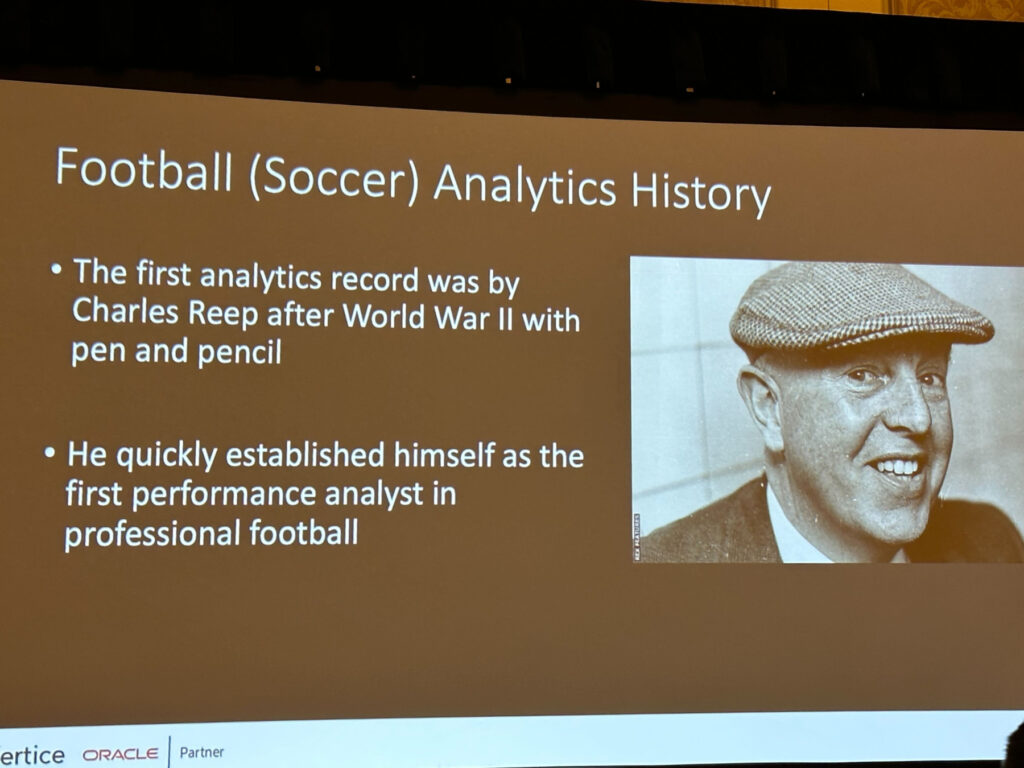
Reep was attending a match between Swindon Town and Bristol Rovers in March 1950. As halftime approached, he grew frustrated by “Swindon’s slow playing style and continuously inefficient scoring attempts.” During the second half, he used a pen, pad, and a recording system that mixed notes and symbols to record basic information about the match including actions, pitch positions, and passing sequences with outcomes. He was able to obtain a complete record of play.
After summarizing the statistics, he made basic recommendations that increased scoring conversion and overall team efficiency. Reep’s analysis of the Swindon Town-Bristol match is widely considered to be the first example of football analytics.
[more about Charles Reep from Sports Performance Analysis]
The Importance of Analytics in Football
Charles Reep was a pioneer and, like Billy Beane, surely had his share of skeptics. Today, sports analysis is widely accepted as a critical piece of coaching and front office management, and constitutes a multi-billion dollar industry that is tied to media broadcasting, technology, sports books, and more.
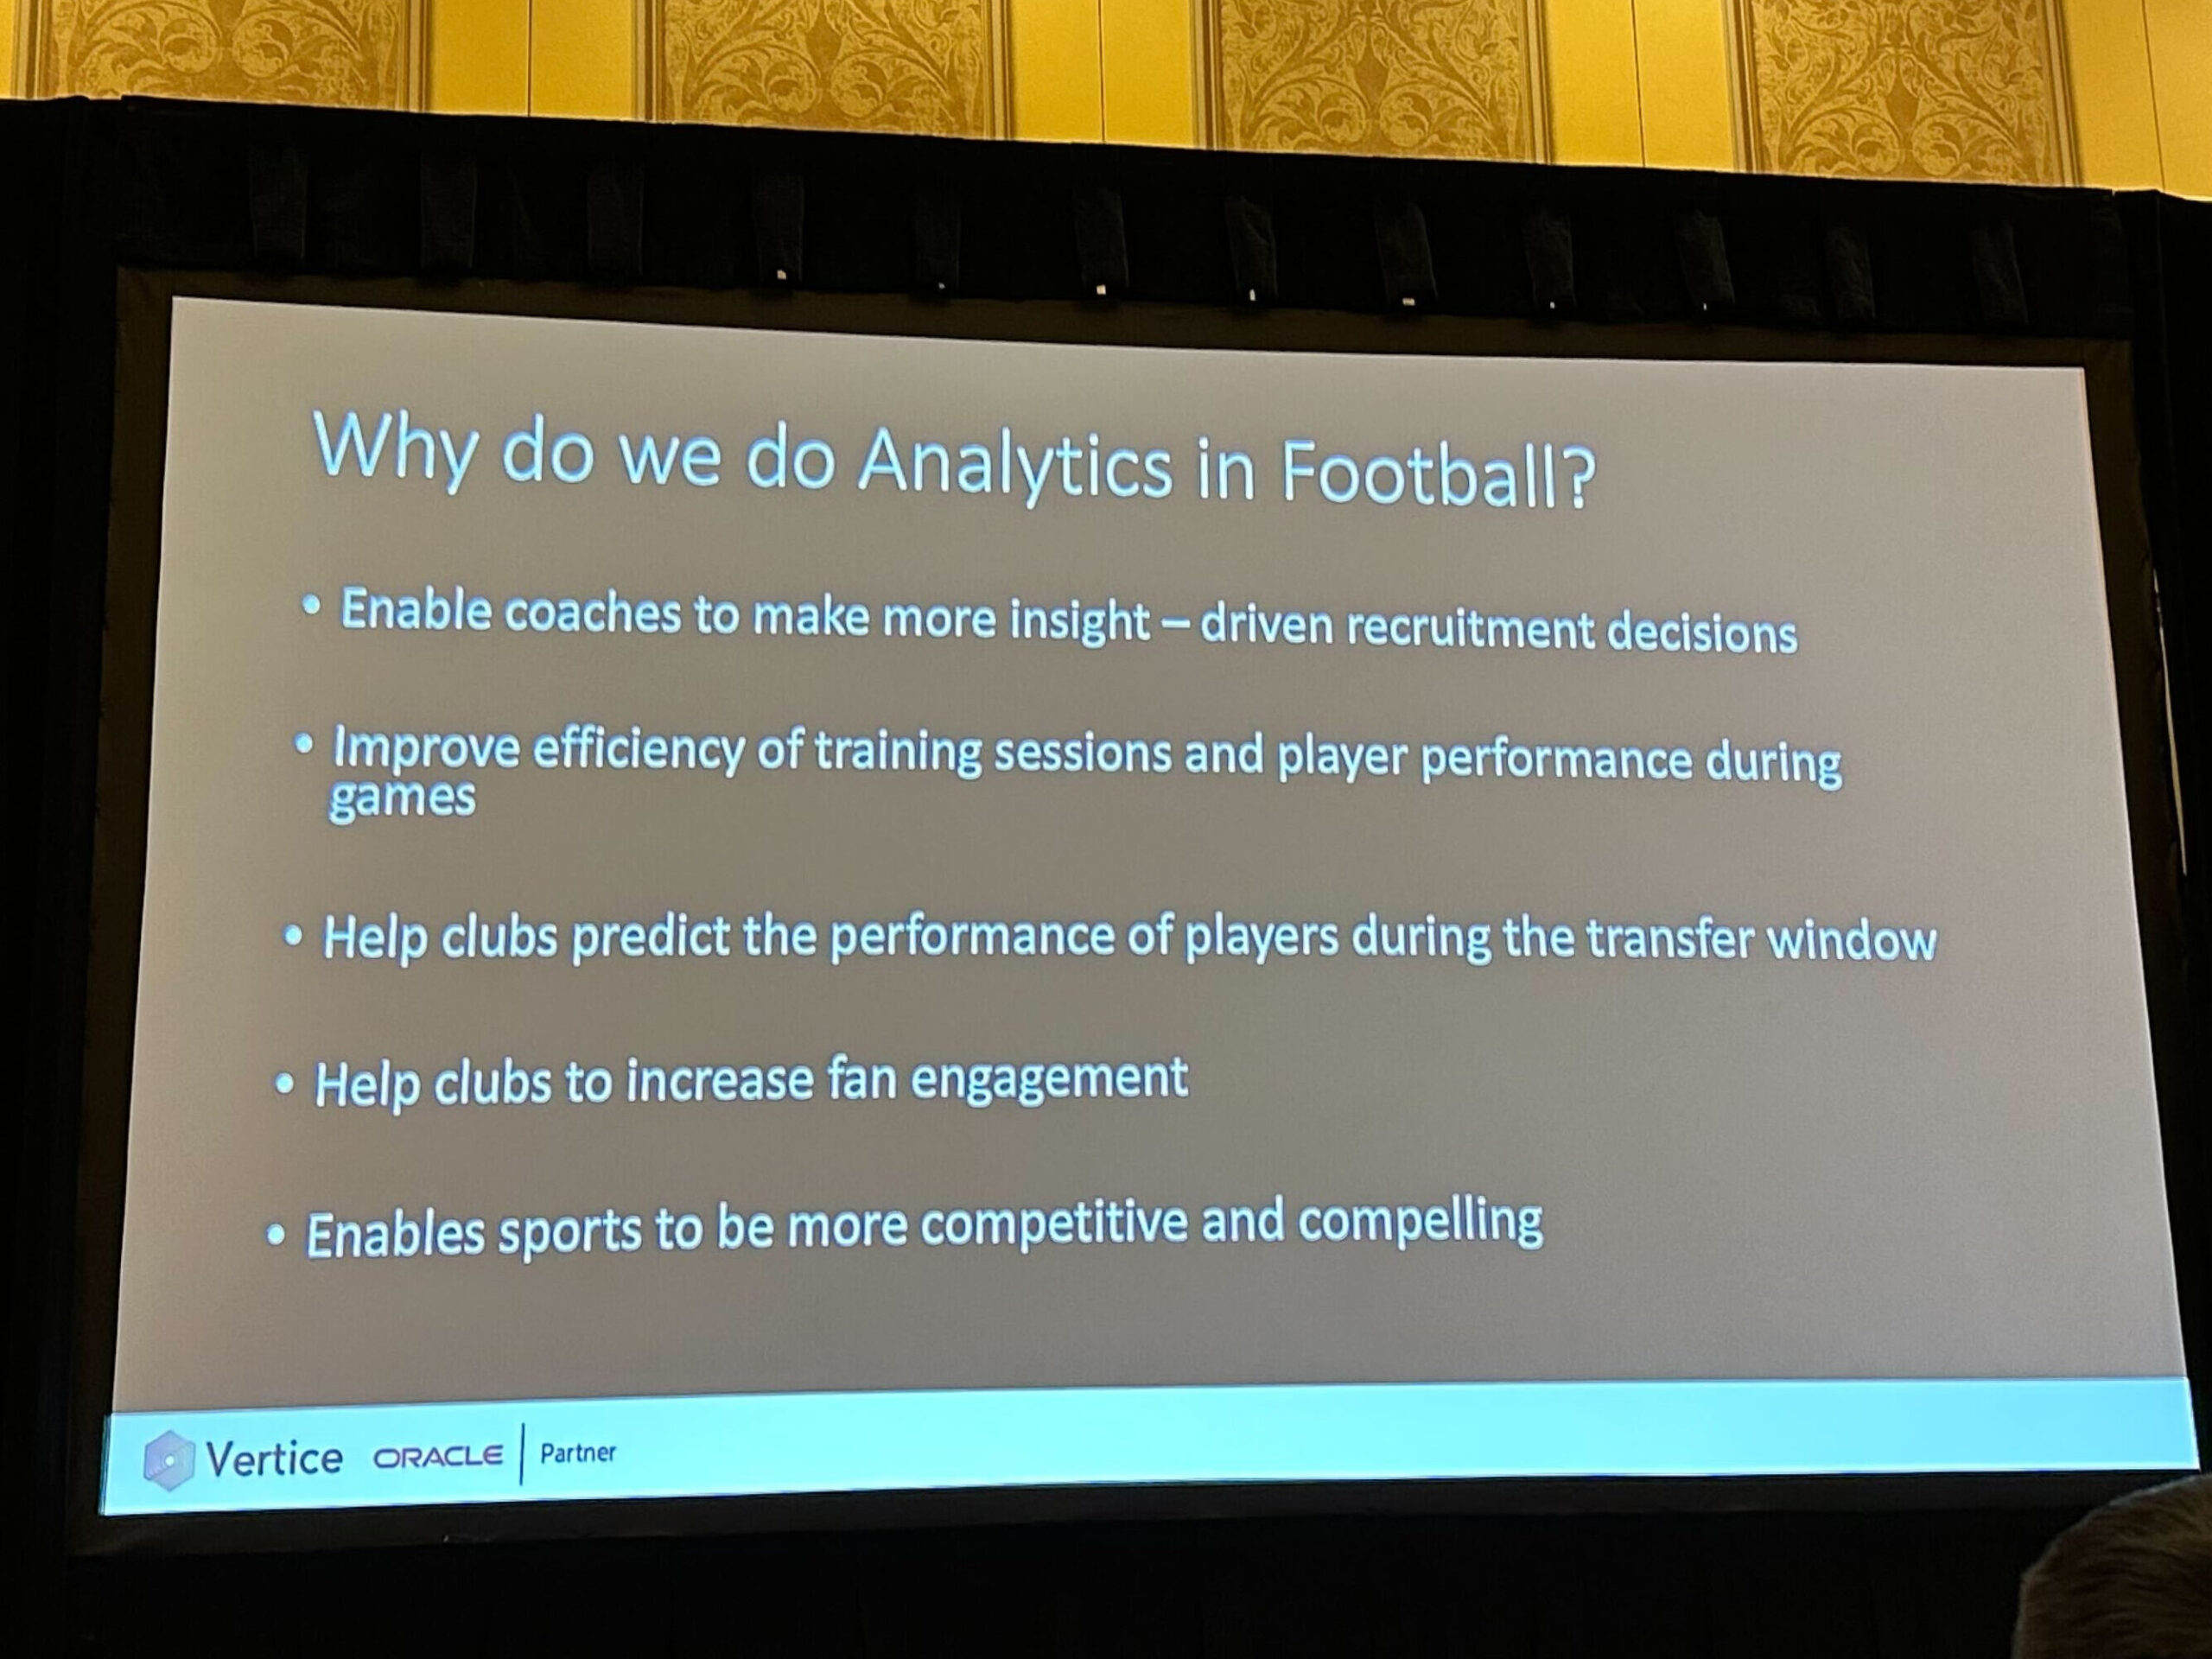
Analysis in football can be useful in improving training efficiency and player performance during games. Additionally, football analytics leads to actionable information and insight-driven decision-making by coaches. Sports analytics are also critical in increasing fan engagement. The entire fantasy sports industry is dependent on the ability to accurately and effectively track a variety of detailed in-game metrics. Overall, football analytics helps to develop a game that is more competitive and interesting to watch.
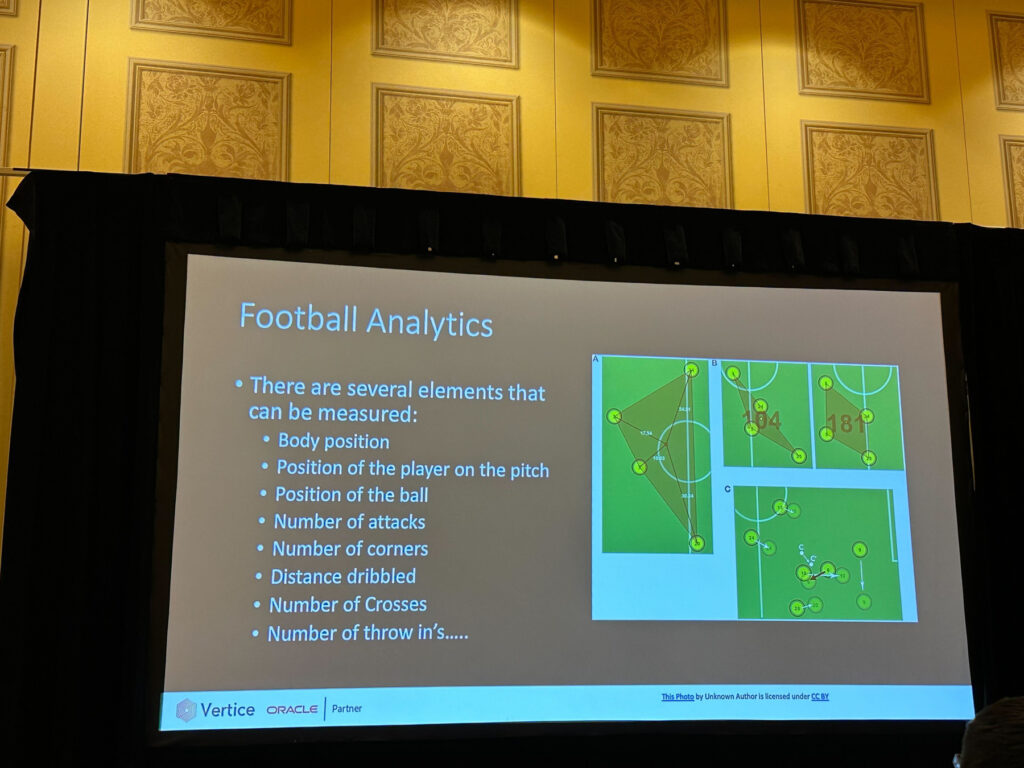
According to the session at CloudWorld, some elements that can be measured in football are: body position, position of the player on the pitch, position of the ball, number of attacks, number of corners, distance dribbled, number of crosses, and number of throw-ins, although there are a plethora of other metrics that can be tracked and analyzed.
Football Passing Networks
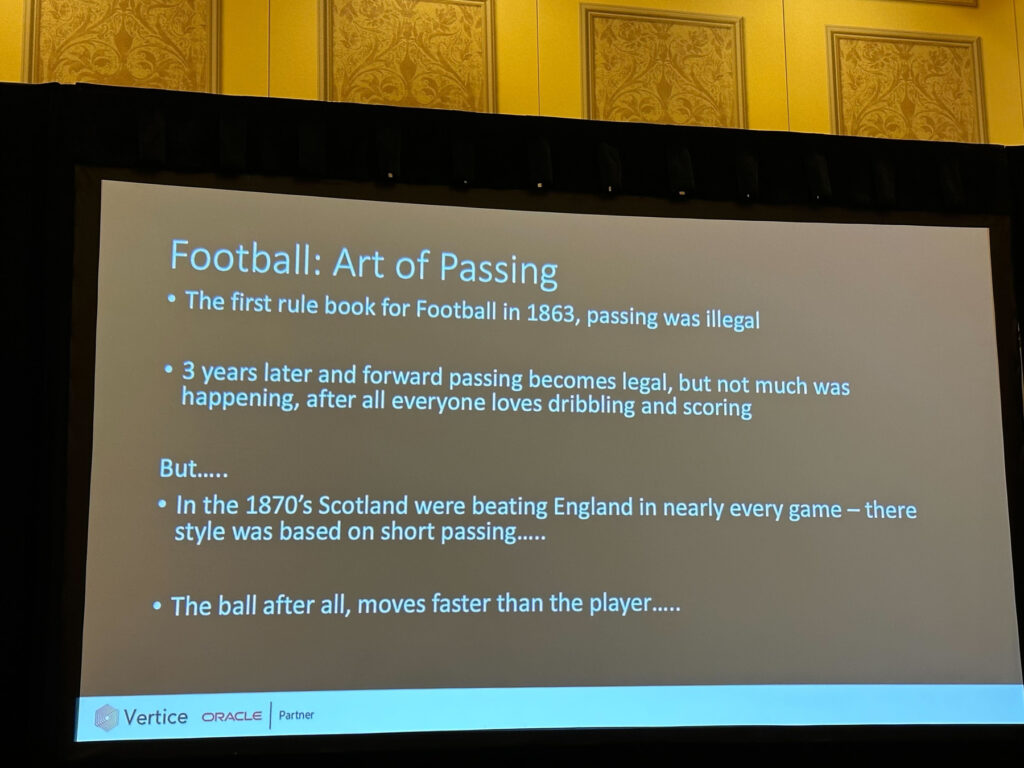
To the surprise of many people, including myself, passing was illegal in the first rule book for football in 1863. Three years later, forward passing became legal, but not many teams were using it. Then, in the 1870’s, Scotland realized that the ball moves faster than the player and were employing a style of play based on short passing to beat England in nearly every match.
The game has evolved drastically in the 150 years since then, and the notion of football without passing would be laughable today.
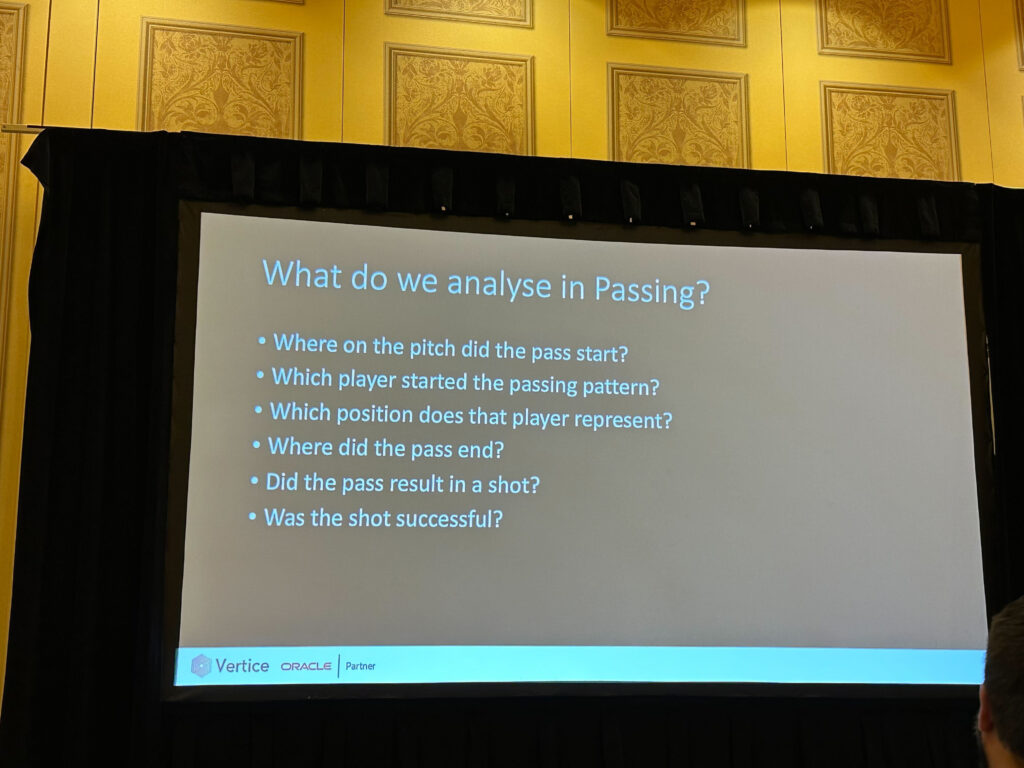
It is relatively easy to explain the importance of passing networks, and football analytics in general, to competitive and professional adult players; however, the role of tactical and statistical analysis is less clear for youth teams.
Coach Giles-Haigh explained, “For older players, I tend to find as long as the data is provided in a visual way then it usually comes across to the players well.” This makes sense as older youth players have generally started to learn different formations and are playing at dedicated positions.
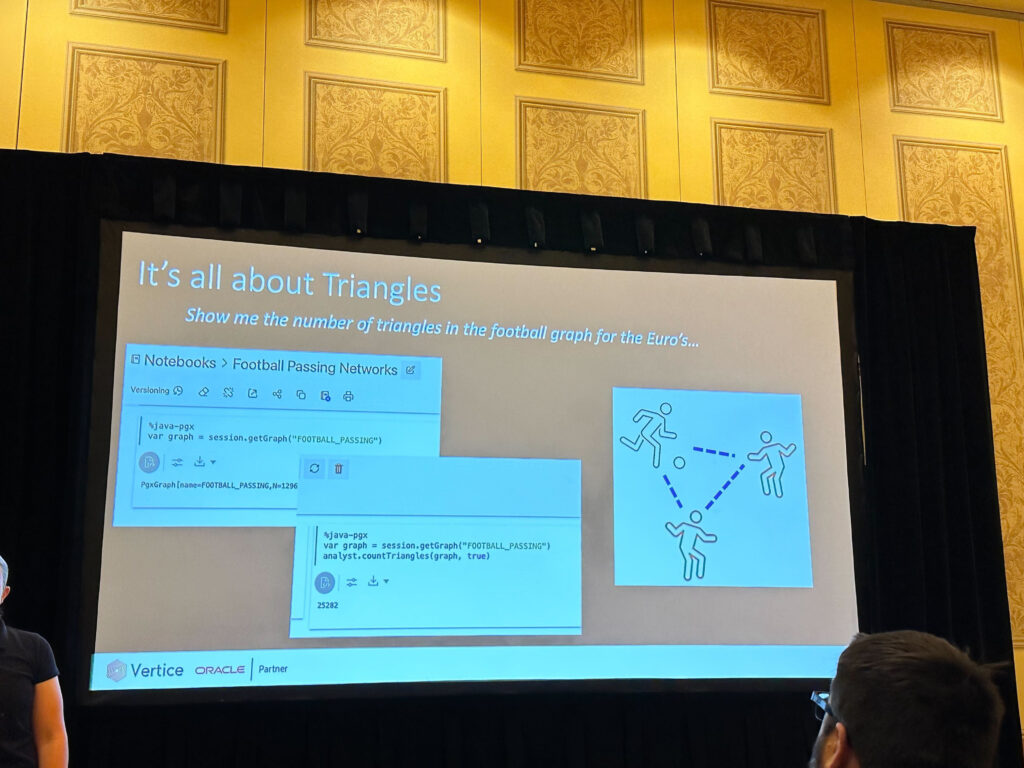
According to Giles-Haigh, “For younger players, it’s much harder to bring the tactical element to life. Passing networks don’t really work, but the number of passes we complete in a game is a good way to show how much as a team we are. “
Oracle ADW for Football Analytics
Oracle Cloud Infrastructure is Oracle’s Infrastructure as a Service (Iaas) offering for compute, network, storage, and more, similar to Amazon Web Services (AWS), Microsoft Azure, and Google Cloud Platform (GCP).
OCI’s Autonomous Data Warehouse (ADW) is “a fully managed database tuned and optimized for data warehouse workloads with the market-leading performance of Oracle Database. It delivers a completely new, comprehensive cloud experience for data warehousing that is easy, fast, and elastic,” according to Oracle’s website.
As a data expert and a football coach, Giles-Haigh decided to see if she could leverage the capabilities of OCI’s ADW and machine learning (ML) to provide insights on her teams’ passing patterns and the impact those patterns have on key performance indicators (KPIs), like shooting and scoring.
“So overall, the system I’ve designed runs for less than £500 per year. In realty, the original version was built on the full ‘always free’ version of Oracle OCI and ADW, ” said Giles-Haigh. “Now with the additional models, I’m still under the £500 a year. “
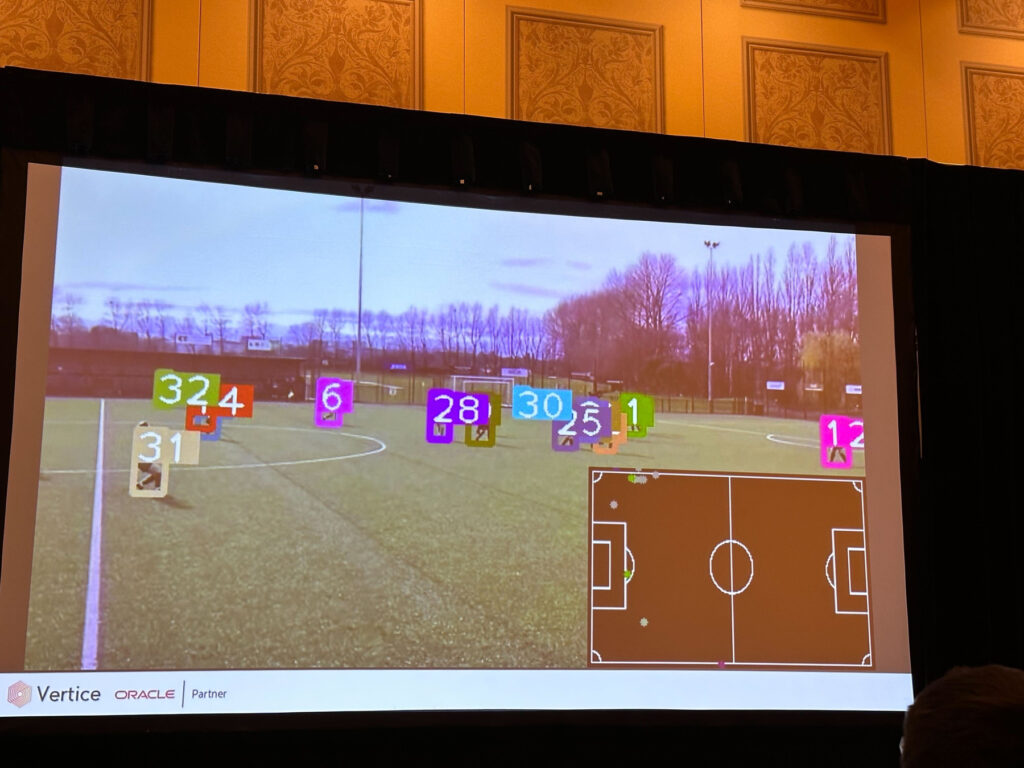
Giles-Haigh’s implementation “[scrapes] the surface of the possible from visual data. The approach looks to describe the visuals into numbers; the skill comes from presenting the data story that other coaches, and players can understand.”
Just like with any data analysis, context is critical. As a football coach, she is in a unique and ideal position to conduct the analysis with this context in mind.
“The part that is to be careful is the context, are we losing, winning, are we in possession or out of possession? This is the part that needs to come next with OCI,” she continued.
With a solid baseline, Abi Giles-Haigh was interested in developing a commercial offering for football analytics from her minimum viable product (MVP). The MVP was developed on a minimal budget, but surely the system could be improved for an organization with more capital to deploy.
Giles-Haigh said, “I think the speed of processing and potentially the number of algorithms running could improve if we increased the amount spent.”
Vertice now owns the commercial rights to the product, CoachConsole. As such the product will likely be improved upon and hopefully offered to additional clubs in the UK, as well as in the US and beyond. As of now, the company has not provided detail about CoachConsole or any other sports analytics offerings.
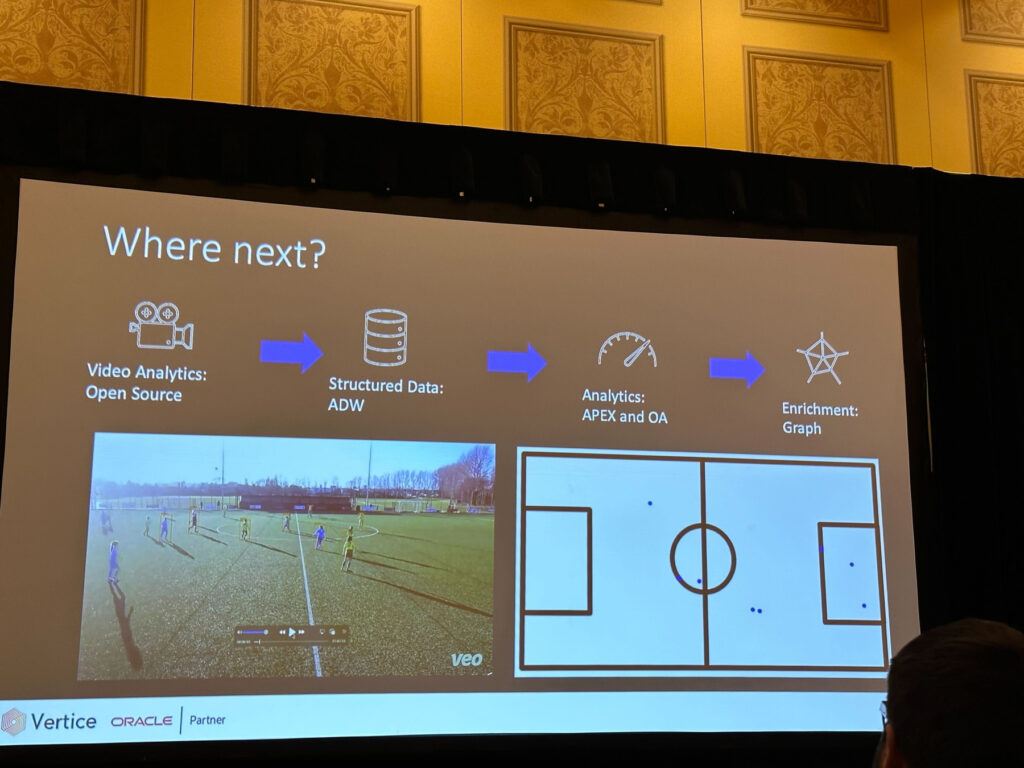
Check Intel Data Sci for updates on CoachConsole and other football analytics/sports analytics products from Vertice in the future. Thank you to Dr. Giles-Haigh for her comments on this article.
Session Description
Graph Analytics Applied to Football—from Raw Data to Winning Strategy [LRN1645] Graph analysis is a powerful technique to gain insight into connections, whether you are investigating inefficiencies in business processes, predicting bottlenecks in supply chains, or analyzing passing networks in football (soccer) matches. This session takes you on an adventure of loading football data into Graph Studio in Oracle Autonomous Data Warehouse, exploring nearest players and passing networks, as well as deriving new insights to help the coaches explore the dynamics within the team. Learn how to tell the story and ensure your analytics are put into practice.
Wed, September 20 11:00 AM – 11:45 AM PDT
Murano 3206, The Venetian, Level 3
Abi Giles-Haigh Chief Data and Technology Officer, Vertice Integration Services Limited
Dr. Abi Giles-Haigh is the chief data and technology officer at Vertice. She has more than 10 years of experience in database management, report writing, and advanced analytics, and was previously was part of the data analytics team at the NHS Business Services Authority—identifying savings and improving patient care. Abi is an Oracle ACE Director and UK Oracle User Group Technical Speaker of the Year 2023. Abi is also a technical evangelist in predictive/prescriptive analytics and data mining.
David Heraty Commercial Manager, Vertice
David Heraty is commercial manager at Vertice, which he joined in 2016 as an analytics consultant. There, he maps his solution focus to business needs in helping drive innovation in Vertice clients. Having helped implement and deliver the world’s first Oracle Analytics implementations, he now speaks at multiple conferences each year about his experience in delivering these award-winning projects as well as sharing his knowledge and experience in other areas in data analytics and AI.
Oracle CloudWorld 2023 Session Catalog
About Vertice Integrated Services Limited
Vertice was established in 2010, to provide Oracle Expert Services. Over the years our offering has both matured and expanded in our focus. We now operate under the basis of; engage the customer, enhance the data and enable the expedient delivery of the solution. Aligned this basis to our depth of knowledge and experience in delivery on; Data Analytics & AI, Database and Infrastructure, on Oracle Technologies, and then we are proven in delivering success in multiple Customers, Data and Solutions.


